Load Testing Multi-Step Workflows with k6 and Grafana
At SilentGrid, we rarely get called in for full-scale load testing - but recently, we had an urgent client request to validate system performance under high user activity. The goal: ensure the system could handle the influx of users expected in the first weeks of operation.
This was a great opportunity to demonstrate how multi-step workflows can be stress-tested using modern tools like k6 and Grafana. In this blog post, we walk through our approach and provide a simplified example to illustrate the process.
Why k6?
We chose k6 mainly because it’s developer-friendly and easy to integrate into existing workflows. Tests are written in JavaScript, which makes them straightforward to read and modify.
Some practical advantages include:
- Simple scripting for multi-step workflows
- Ability to run tests locally
- Easy integration with cloud dashboards
- Good visibility into request metrics
Quick validation can be done locally, while sending results to Grafana Cloud provides dashboards and historical metrics.
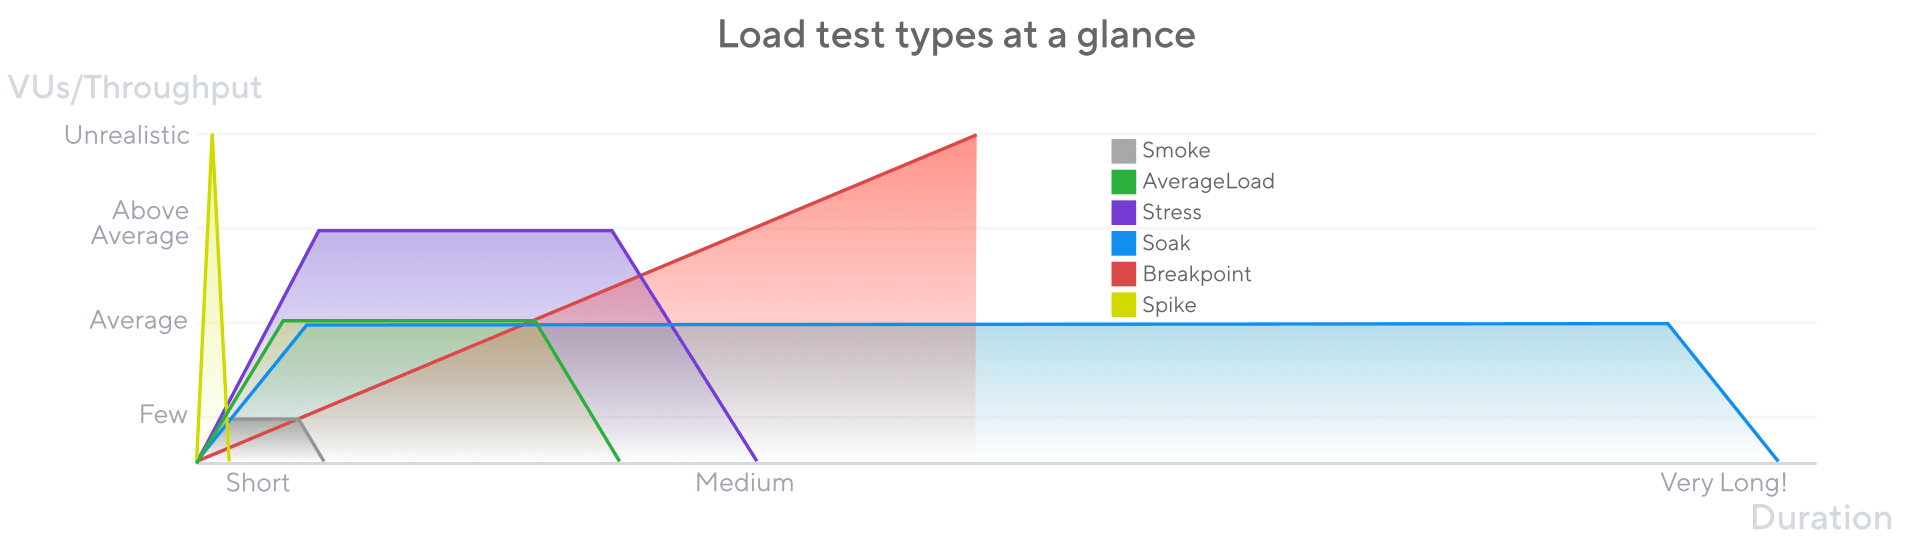
Load Testing Types
Every application experiences different loads at different times. Understanding how your system performs under these scenarios is crucial for ensuring reliability and user satisfaction. Here’s a quick overview of typical load testing scenarios:
- Smoke Test: Simulates a single user or very light activity. Verifies system setup and basic functionality.
- Normal Load: Reflects expected day-to-day activity. Confirms the system scales under typical operational conditions.
- Peak Load: Simulates “Go-Live” conditions with high concurrency. Identifies bottlenecks and ensures the system can handle maximum expected traffic.
- Stress Test: Pushes the system beyond expected limits to reveal breaking points, failure modes, and recovery behavior.
- Soak Test: Sustained load over hours or days to uncover memory leaks, slow degradation, or long-term stability issues.
- Spike Test: Sudden bursts of traffic over a short period to test autoscaling, throttling, and response to unexpected surges.
Tools We Used
To tackle this challenge, we relied on a mix of open-source and cloud-hosted tools:
- k6 - An open-source load testing tool that simulates user interactions and measures performance.
- Grafana Cloud (k6 Cloud) - A cloud service that collects and visualizes test results at scale.
- Grafana Dashboards - Visual dashboards that display metrics like response times, errors, and trends.
- Test Data and Authentication - Ensures unique test data for each run and secures credentials while simulating real users
The goal was to keep the setup simple while still producing useful metrics.
Multi-Step Forms: A Hidden Complexity
Even a “simple” form can be surprisingly complex under the hood. Many workflows, especially in ASP.NET, require multiple hidden fields like __VIEWSTATE and __EVENTVALIDATION, along with modal sub-forms and background triggers.
To illustrate, consider the following form's workflow:
- Step 1: Submit personal details
- Step 2: Submit address information
- Step 3: Trigger backend workflow
- Step 4+: Additional modals or qualification forms
Demonstrating with a Flask Example
To show how multi-step load testing works, we built a small Flask app simulating a multi-step registration form:
# Flask multi-step form demo
from flask import Flask, request, jsonify
import uuid

app = Flask(__name__)
VALID_TOKEN = "test-token-123"

def check_auth():
    return request.headers.get("Authorization") == f"Bearer {VALID_TOKEN}"

@app.route('/form/step1', methods=['POST'])
def step1():
    if not check_auth():
        return jsonify({"error": "Unauthorized"}), 401
    registration_id = str(uuid.uuid4())
    return jsonify({"registrationId": registration_id}), 200

@app.route('/form/step2', methods=['POST'])
def step2():
    if not check_auth():
        return jsonify({"error": "Unauthorized"}), 401
    data = request.get_json()
    registration_id = data.get("registrationId")
    if not registration_id:
        return jsonify({"error": "Missing registrationId"}), 400
    return jsonify({"registrationId": registration_id, "status": "address saved"}), 200
This example keeps the workflow simple while still demonstrating how state from one step must be passed into the next.
Running a Multi-Step Load Test in k6
Here is a basic k6 script that simulates users completing both steps of the form.
import http from 'k6/http';
import { check } from 'k6';

export const options = {
  vus: 10,
  duration: '1m',
};

const BASE_URL = 'http://localhost:5000';
const HEADERS = { Authorization: 'Bearer test-token-123', 'Content-Type': 'application/json' };

export default function () {
  // Step 1
  let step1Res = http.post(`${BASE_URL}/form/step1`, JSON.stringify({ name: `TestUser-${__VU}` }), { headers: HEADERS });
  check(step1Res, { 'step1 OK': (r) => r.status === 200 });
  let registrationId = step1Res.json().registrationId;

  // Step 2
  let step2Res = http.post(`${BASE_URL}/form/step2`, JSON.stringify({ registrationId }), { headers: HEADERS });
  check(step2Res, { 'step2 OK': (r) => r.status === 200 });
}
Each iteration creates a unique record. Metrics for each step can be tracked in Grafana dashboards.
Executing the Test
Local execution:
After installing k6, the script can be run locally:
k6 run loadtest.jsCloud execution (send metrics while running locally):
If you want to stream metrics to Grafana Cloud while executing locally:
- Login to Grafana Cloud:
k6 cloud login --token <token> --stack "<stack_id>"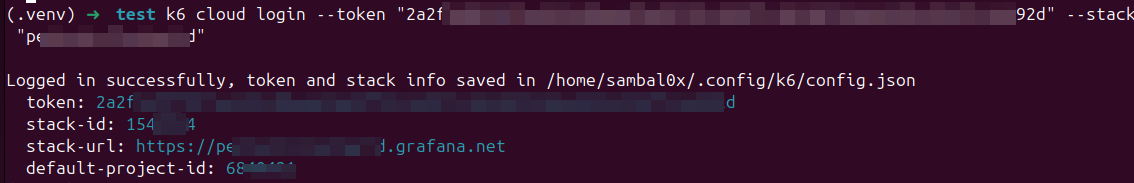
- Run the test and send results to the cloud:
k6 cloud run --local-execution loadtest.js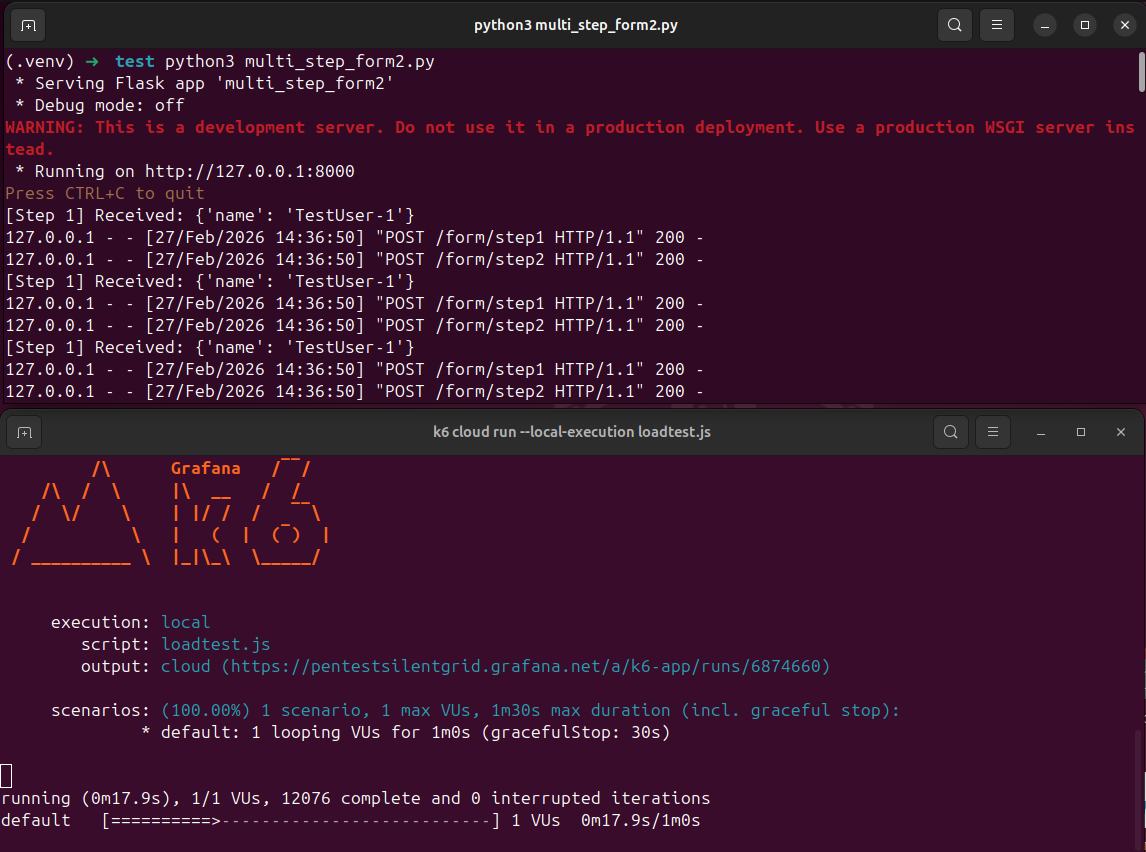
Full cloud execution
To run the test completely in the cloud (without local execution):
k6 cloud run loadtest.jsRunning tests in the cloud allows for larger, more consistent load simulations without taxing your local machine, while providing real-time metrics in Grafana dashboards.
Interpreting Results
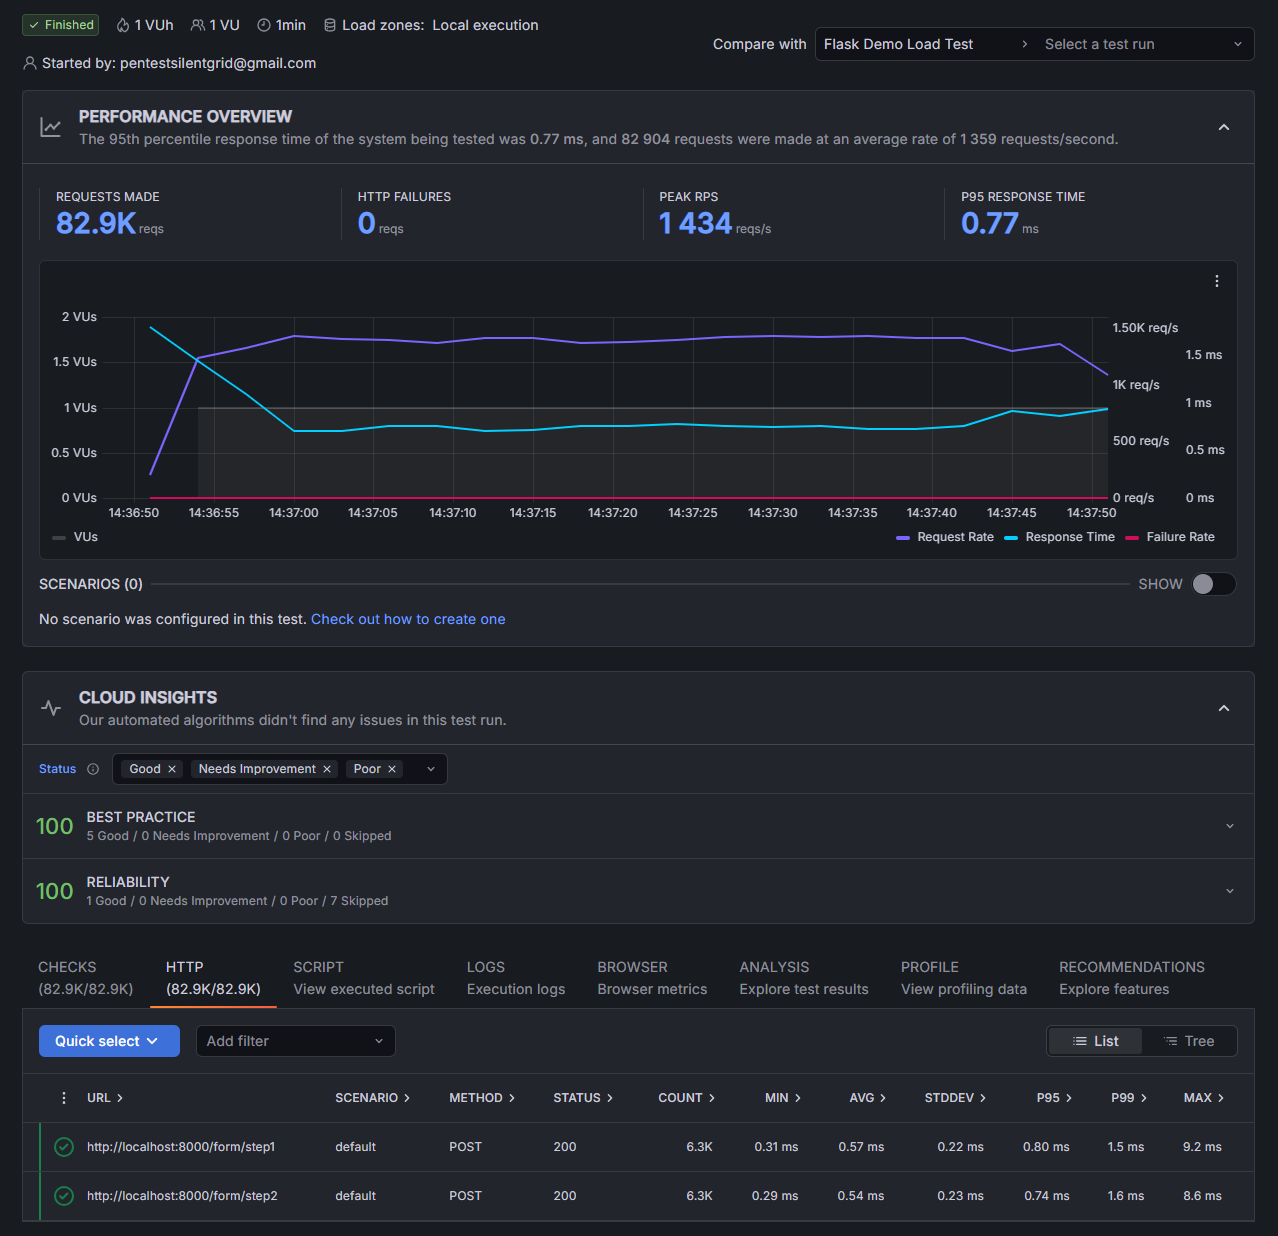
Grafana Cloud makes test results easy to interpret:
- Performance Overview - The top graph shows load (RPS) and response time. A flat response line means stable performance.
- Summary Metrics - Key stats like total requests, HTTP failures, peak RPS, and P95 response time give a quick health snapshot.
- Checks & HTTP Results - Lists each endpoint, response codes, and timing -useful for spotting slow steps.
- Cloud Insights - Automated validation confirming the test ran cleanly with no major issues.
In short, the dashboards show how much load was applied, how the system responded, and where any bottlenecks appeared.
Calculating Test Loads
Designing a realistic load test often starts by estimating expected traffic.
For example, if a system expects 15,000 form submissions during an 8-hour workday, we can approximate the average request rate.
15,000 submissions
÷ 8 hours
÷ 3600 seconds
≈ 0.52 requests per second
That average number may seem low, but real traffic is rarely evenly distributed. Activity often clusters around certain times of day.
For testing purposes, we might simulate higher loads, such as:
- Normal load: 1–2 requests per second
- Peak load: 5–10 requests per second
- Stress test: progressively increasing beyond expected traffic
Another detail that often confuses people (and something we ran into during testing) is the difference between virtual users (VUs) and requests per second (RPS).
Some tests control the number of concurrent users interacting with the system, while others control the rate of incoming requests. For user-driven workflows like forms, modelling arrival rate (RPS) can sometimes better represent real-world traffic, since it simulates new users arriving continuously rather than a fixed pool of users repeating actions.
In practice, both approaches are useful depending on the type of system being tested.
The key goal isn’t perfect mathematical precision - it’s creating realistic load patterns that help uncover bottlenecks before real users experience them.
Final Thoughts
Load testing doesn’t always need to be large or complex to be useful. Even relatively small tests can uncover slow endpoints, configuration issues, or workflow problems.
In our experience, the most time-consuming part is usually mapping out the real workflow being tested. Once that behaviour is understood, tools like k6 make it fairly straightforward to automate and repeat the tests.
For teams preparing for a launch or expecting higher traffic, running a few targeted load tests can provide useful insight into how the system will behave under real-world conditions.